Predicting Protein Structure and Interactions
Prediction Pipeline: Starting from a protein sequence how to determine its structure and function?
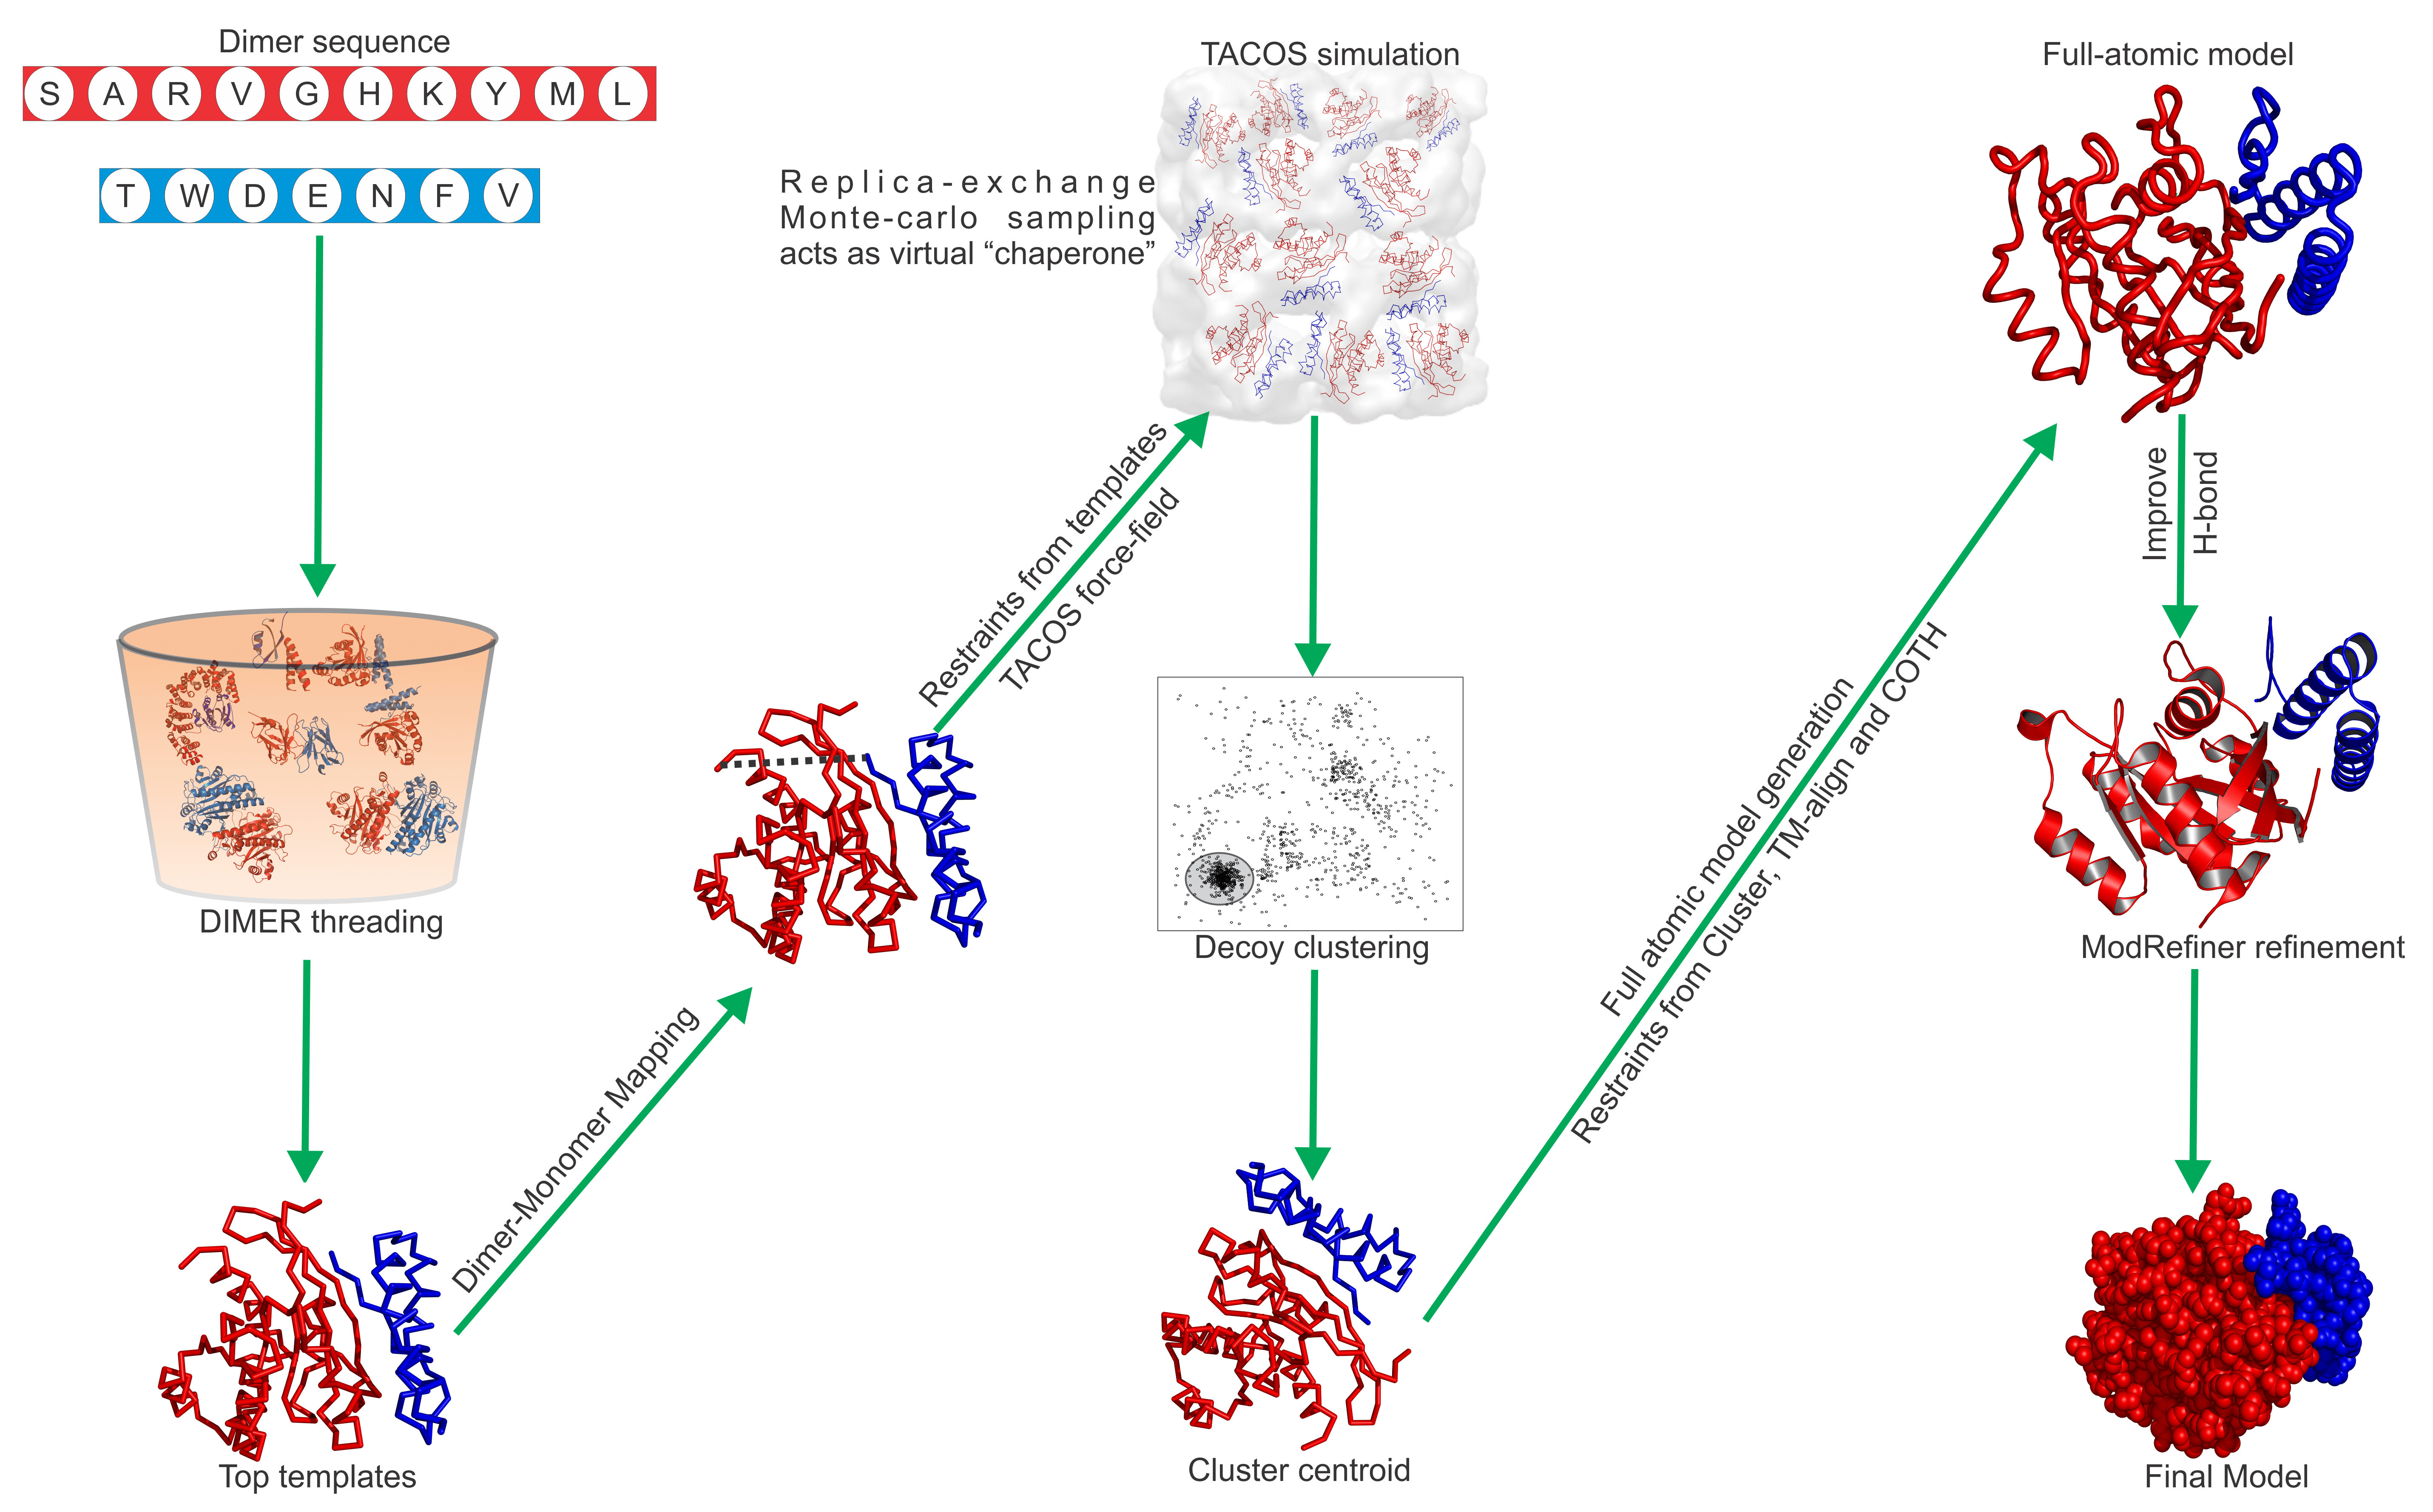
Pipeline Steps
- The sequence is searched through a series of protein related database to find related sequences with known properties related to structure and function.
- Dynamic assembly of equation parameters based on availabe information. A series of equations are predetermined based on feature analysis. The linear combination of terms are determined from identified similarities in the Protein database.
- The initial image is randomly generation based on sequence the prompt and identified information. The less sequence information available the further the guess is from the correct solution.
- Starting from the initial images random distorations are added to the image. The image improvement are guided by an equation. After so many iterations the process is stopped and the current image is saved.
- Step 2 and 3 are repeated several thousand times.
- The best answer is determined by which image minimizes the equation.
- Local features from the neighborhood of the highest rank image are integrated into the model by superimposing based on consensus image features and averaging together.
Image Similarity and Superposition:
Similar to protein sequences, protein structures need to be aligned in order to evaluate the similarity. Given a superposition, one way is to compare structures is to calculate the root mean squared error between a set of points.

Kabsch derived the solution for finding the optimal solution of y onto x as to minimize the RMSD. First the equation is squared and mean squared deviation is used for simplicity and the equation is expanded.

Notice that the first summation term is not dependent on U and can be removed from consideration. In order to minimize the RMSD we need to maximize.

Converting the equation into vector notation leads to the equation below with the goal of maximizing L.

Now using the cyclic property of the transpose the equation can be written as follows where R can be calculated and U is unknown.

R is the correlation matrix and using singular value decomposition it can be rewritten as R = V ∗ S ∗ W T where V and W are orthogonal matricies and S is a diagonal matrix containing the singular values. Replacing R with the SVD and using the trace cyclic property

The matrices W T ,U,V are replaced with the matrix T, which is the product of orthogonal matrices, which leads to
Since T is orthogonal and T ii <= 1, the trace is maximized when T equals the Identity Matrix. The Kabsch algorithm optimal rotation matrices can either be in the right handed coordinate system or left handed system (determinant of U equals -1). In order to convert a left handed system to right handed the last column of U needs to be multiplied by negative one.

Structural scoring systems that can properly identify global structure similarity are important. The TMscore was designed to consider the alignment coverage and pairwise distance proximities in order to calculate a similarity score.

Physical Score: The initial attempts to determine protein structure and model its dynamics consisted of created physical potentials and incorporating them into a molecular dynamics simulation. The Amber and Charm force fields are among the most commonly used. Amber uses the first five and charm adds the second two. The first two terms refer to proper bond lengths and angles. The dihedrals refer to the phi and psi angles in the protein backbone. The next terms are the Vander Waals and electrostatic potentials. The last terms refer to bond bending.

Statistical Energy Scores and Information Based Restraints: Information from the PDB can improve the modeling and prediction of protein structure. These knowledge based simulations incorporate PDB structural information in the form of statistical potentials, folding biases, rotamer libraries and homology derived restraints. The statistical potentials derived from the PDB are based on the theoretical foundations of the Boltzmann distribution. The Boltzmann distribution is an equation that describes the population of different states and the respective energy of that state. With lower the energies corresponding to the more populated states.
Orientation: For any residue i and j in opposite chains which are in contact, the orientation of the unit bisector vectors of i and j can be in three different orientations as defined by their dot product: parallel, anti-parallel or perpendicular. e(A i , A j , γ i,j ) is the probability of an amino acid pair to be in the orientation γ i,j

DFIRE: Probability of an amino acid being in an local environment of other amino acids

Pairwise Amino Preference: Frequence of a pair of amino acids being in close contact.

Distance Restraints: Distance restraints obtained from global and local images.

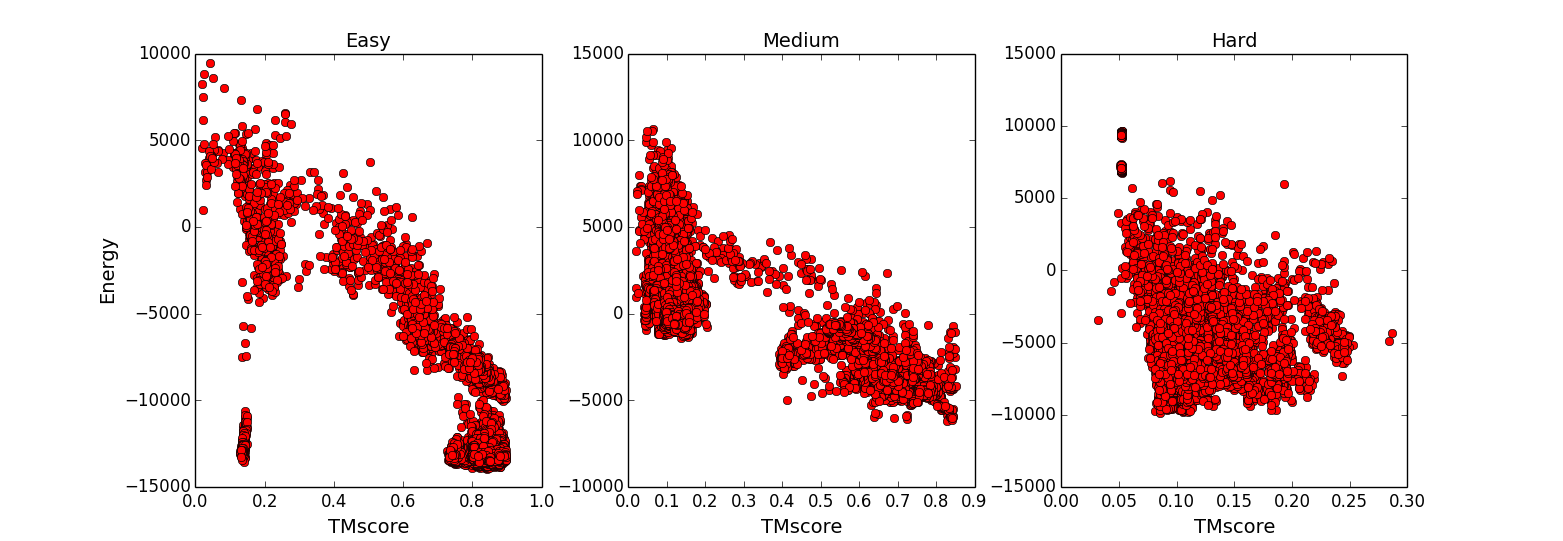
Correlation to Ground Truth: To partly assess the quality of our force field, the Pearson’s correlation coefficient was calculated between the energy and the TM-score of decoys to the structure of the native complex. The correlation can have variation depending on the quality of the complex and monomeric templates.
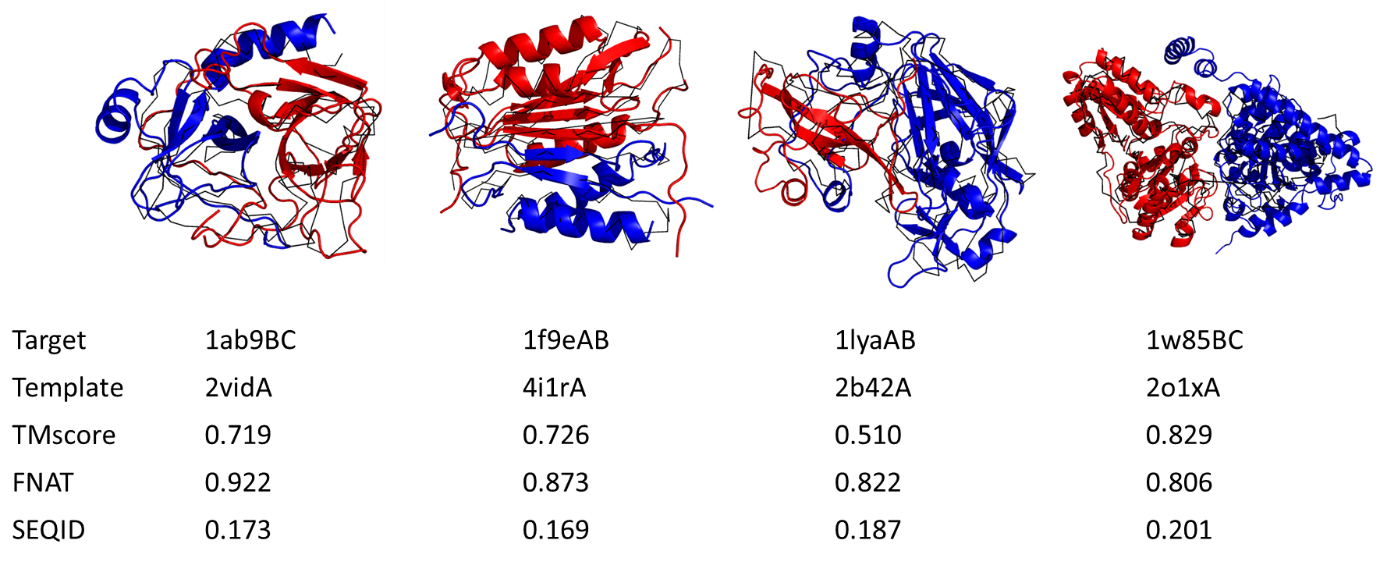
Predicted Models: Near-native models built by TACOS. Plot showing examples of TACOS modeling for both homo- and heterodimers. The predicted models are shown in red and slate for chain A and B; the native structure shown as a black line is superimposed onto the model structure.
Predicting Interaction Networks: The entire E. coli genome was modelled by the structure prediction pipelines I-TASSER and QUARK. Using SPRING 46,033 dimer complexes were predicted in the E. coli. Using the pregenerated data from I-TASSER, TACOS can be used to refine and assemble the predicted protein dimeric interactions. The models from I-TASSER and QUARK can be used in the initial stage of dimer threading to identify distant homology complexes and improve recognition of conserved binding residues at the interface.
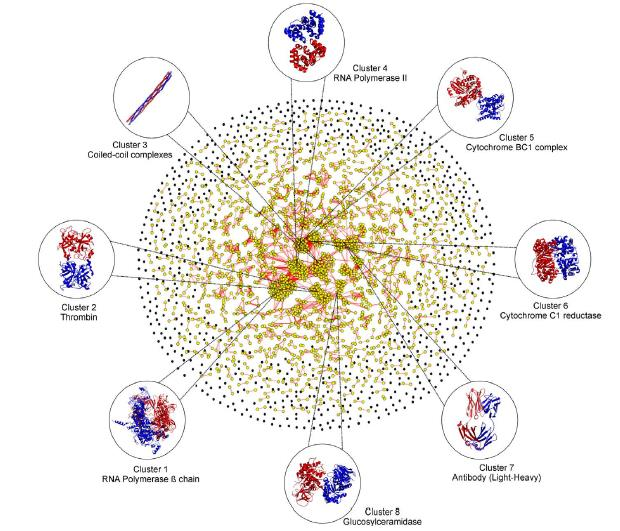
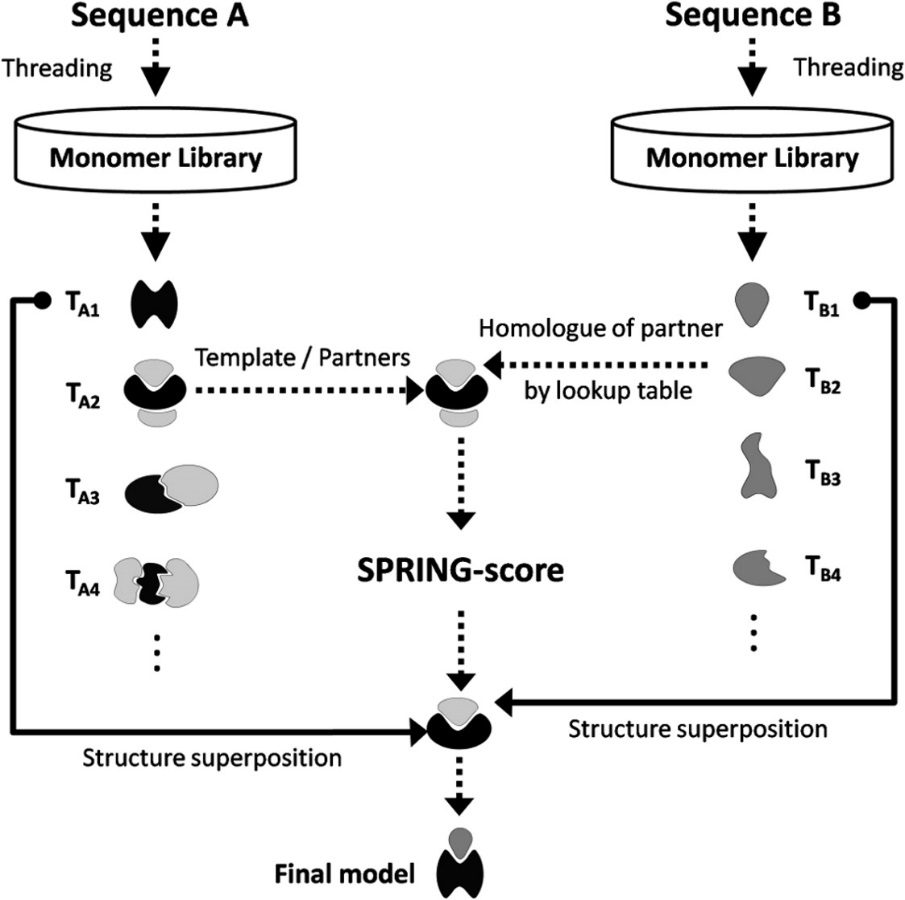
Interaction Network Superposition: SPRING is a template-base algorithm for protein-protein complex structure prediction. The pipeline first threads one chain of the protein complex through the PDB library with the binding parters retrieved from the original oligomer entries. The complex models for the query are then deduced from the template binding partner associations through a pre-calculated look-up table. The model of the best orientation is finally selected by the SPRING-score that is a combination of threading Z-score, interface contacts, and TM-align match between monomer-to-dimer templates. The final goal was to build full atom models using TACOS as a final refinement step.
Conclusion: The general approach to predict macromolecular structures has been significantly starting in 2016. Now deep learning is used to create to energy function to guide the simulations.
Articles and Publications
- Zhang, W., Yang, J., He, B., Walker, S.E., Zhang, H., Govindarajoo, B., Virtanen, J., Xue, Z., Shen, H.B. and Zhang, Y., 2016. Integration of QUARK and I‐TASSER for ab initio protein structure prediction in CASP11. Proteins: Structure, Function, and Bioinformatics, 84, pp.76-86.
- Guerler, A., Govindarajoo, B. and Zhang, Y., 2013. Mapping monomeric threading to protein–protein structure prediction. Journal of chemical information and modeling, 53(3), pp.717-725.
- Xu, T., Park, S.S., Giaimo, B.D., Hall, D., Ferrante, F., Ho, D.M., Hori, K., Anhezini, L., Ertl, I., Bartkuhn, M. and Zhang, H., 2017. RBPJ/CBF 1 interacts with L3 MBTL 3/MBT 1 to promote repression of Notch signaling via histone demethylase KDM 1A/LSD 1. The EMBO journal, 36(21), pp.3232-3249.
- Yang, J., Zhang, W., He, B., Walker, S.E., Zhang, H., Govindarajoo, B., Virtanen, J., Xue, Z., Shen, H.B. and Zhang, Y., 2016. Template‐based protein structure prediction in CASP11 and retrospect of I‐TASSER in the last decade. Proteins: Structure, Function, and Bioinformatics, 84, pp.233-246.
- Li, H.D., Menon, R., Govindarajoo, B., Panwar, B., Zhang, Y., Omenn, G.S. and Guan, Y., 2015. Functional networks of highest-connected splice isoforms: from the chromosome 17 human proteome project. Journal of proteome research, 14(9), pp.3484-3491.
- Xue, Z., Jang, R., Govindarajoo, B., Huang, Y. and Wang, Y., 2015. Extending protein domain boundary predictors to detect discontinuous domains. PLoS One, 10(10), p.e0141541.
- Govindarajoo, B., 2016. Template Based Modeling and Structural Refinement of Protein-Protein Interactions (Doctoral dissertation).